Getting started with R
Mikhail Dozmorov
Virginia Commonwealth University
08-23-2023
Why programming
Programming will make your academic journey better.
Instead of remembering what buttons you clicked, what analyses you did, you write scripts with exact commands implementing your analysis and allow others to understand/reproduce it (or, spot mistakes).
Programming forces you to have a deeper understanding of what you are doing, and facilitates your learning and comprehension of the methods you use.
Why R?
R is a programming language designed for data analysis and statistics.
Extremely powerful for statistical modeling, machine learning, data manipulation, and visualization.
- Efficient data analysis on data of all shapes and sizes (big data including).
- Optimized operations on vectors, matrices, lists.
- Very sophisticated graphs and data visualizations.
Not just scripts, but fully reproducible reports, papers, presentations, web applications.
Free, cross-platform, and open-source.
Why R?
- Thousands of packages that add extra functionality. Covering virtually all scientific disciplines and analytical frameworks.
- Image analysis, geospatial, epidemiology, genetics, bioinformatics, and a lot more.
19,772 CRAN (The Comprehensive R Archive Network) packages and 2,230 Bioconductor packages, as of 08/21/2023
18,000 CRAN packages, tweet by Dirk Eddelbuettel, 2021-08-11
R can connect to spreadsheets, databases, and many other data formats, on your computer or on the web.
Large and welcoming user community.
RStudio
RStudio is an IDE (integrated development environment) to work with R, with many features and functionalities for efficient work.
Integrates file navigation, visualization, documentation, version control and project management.
You write the same R code in RStudio as you would elsewhere, and it executes the same way. RStudio helps by keeping things nicely organized.
Free, cross-platform, and open-source.
Developed by Posit (formerly, Rstudio) company.
Why RStudio
Project-centric work - scripts and data are organized in one folder (project), easily accessible.
Work on multiple projects simultaneously in several instances of RStudio.
Work on multiple (types of) scripts.
After you install R and RStudio, you only need to run RStudio.
RStudio interface
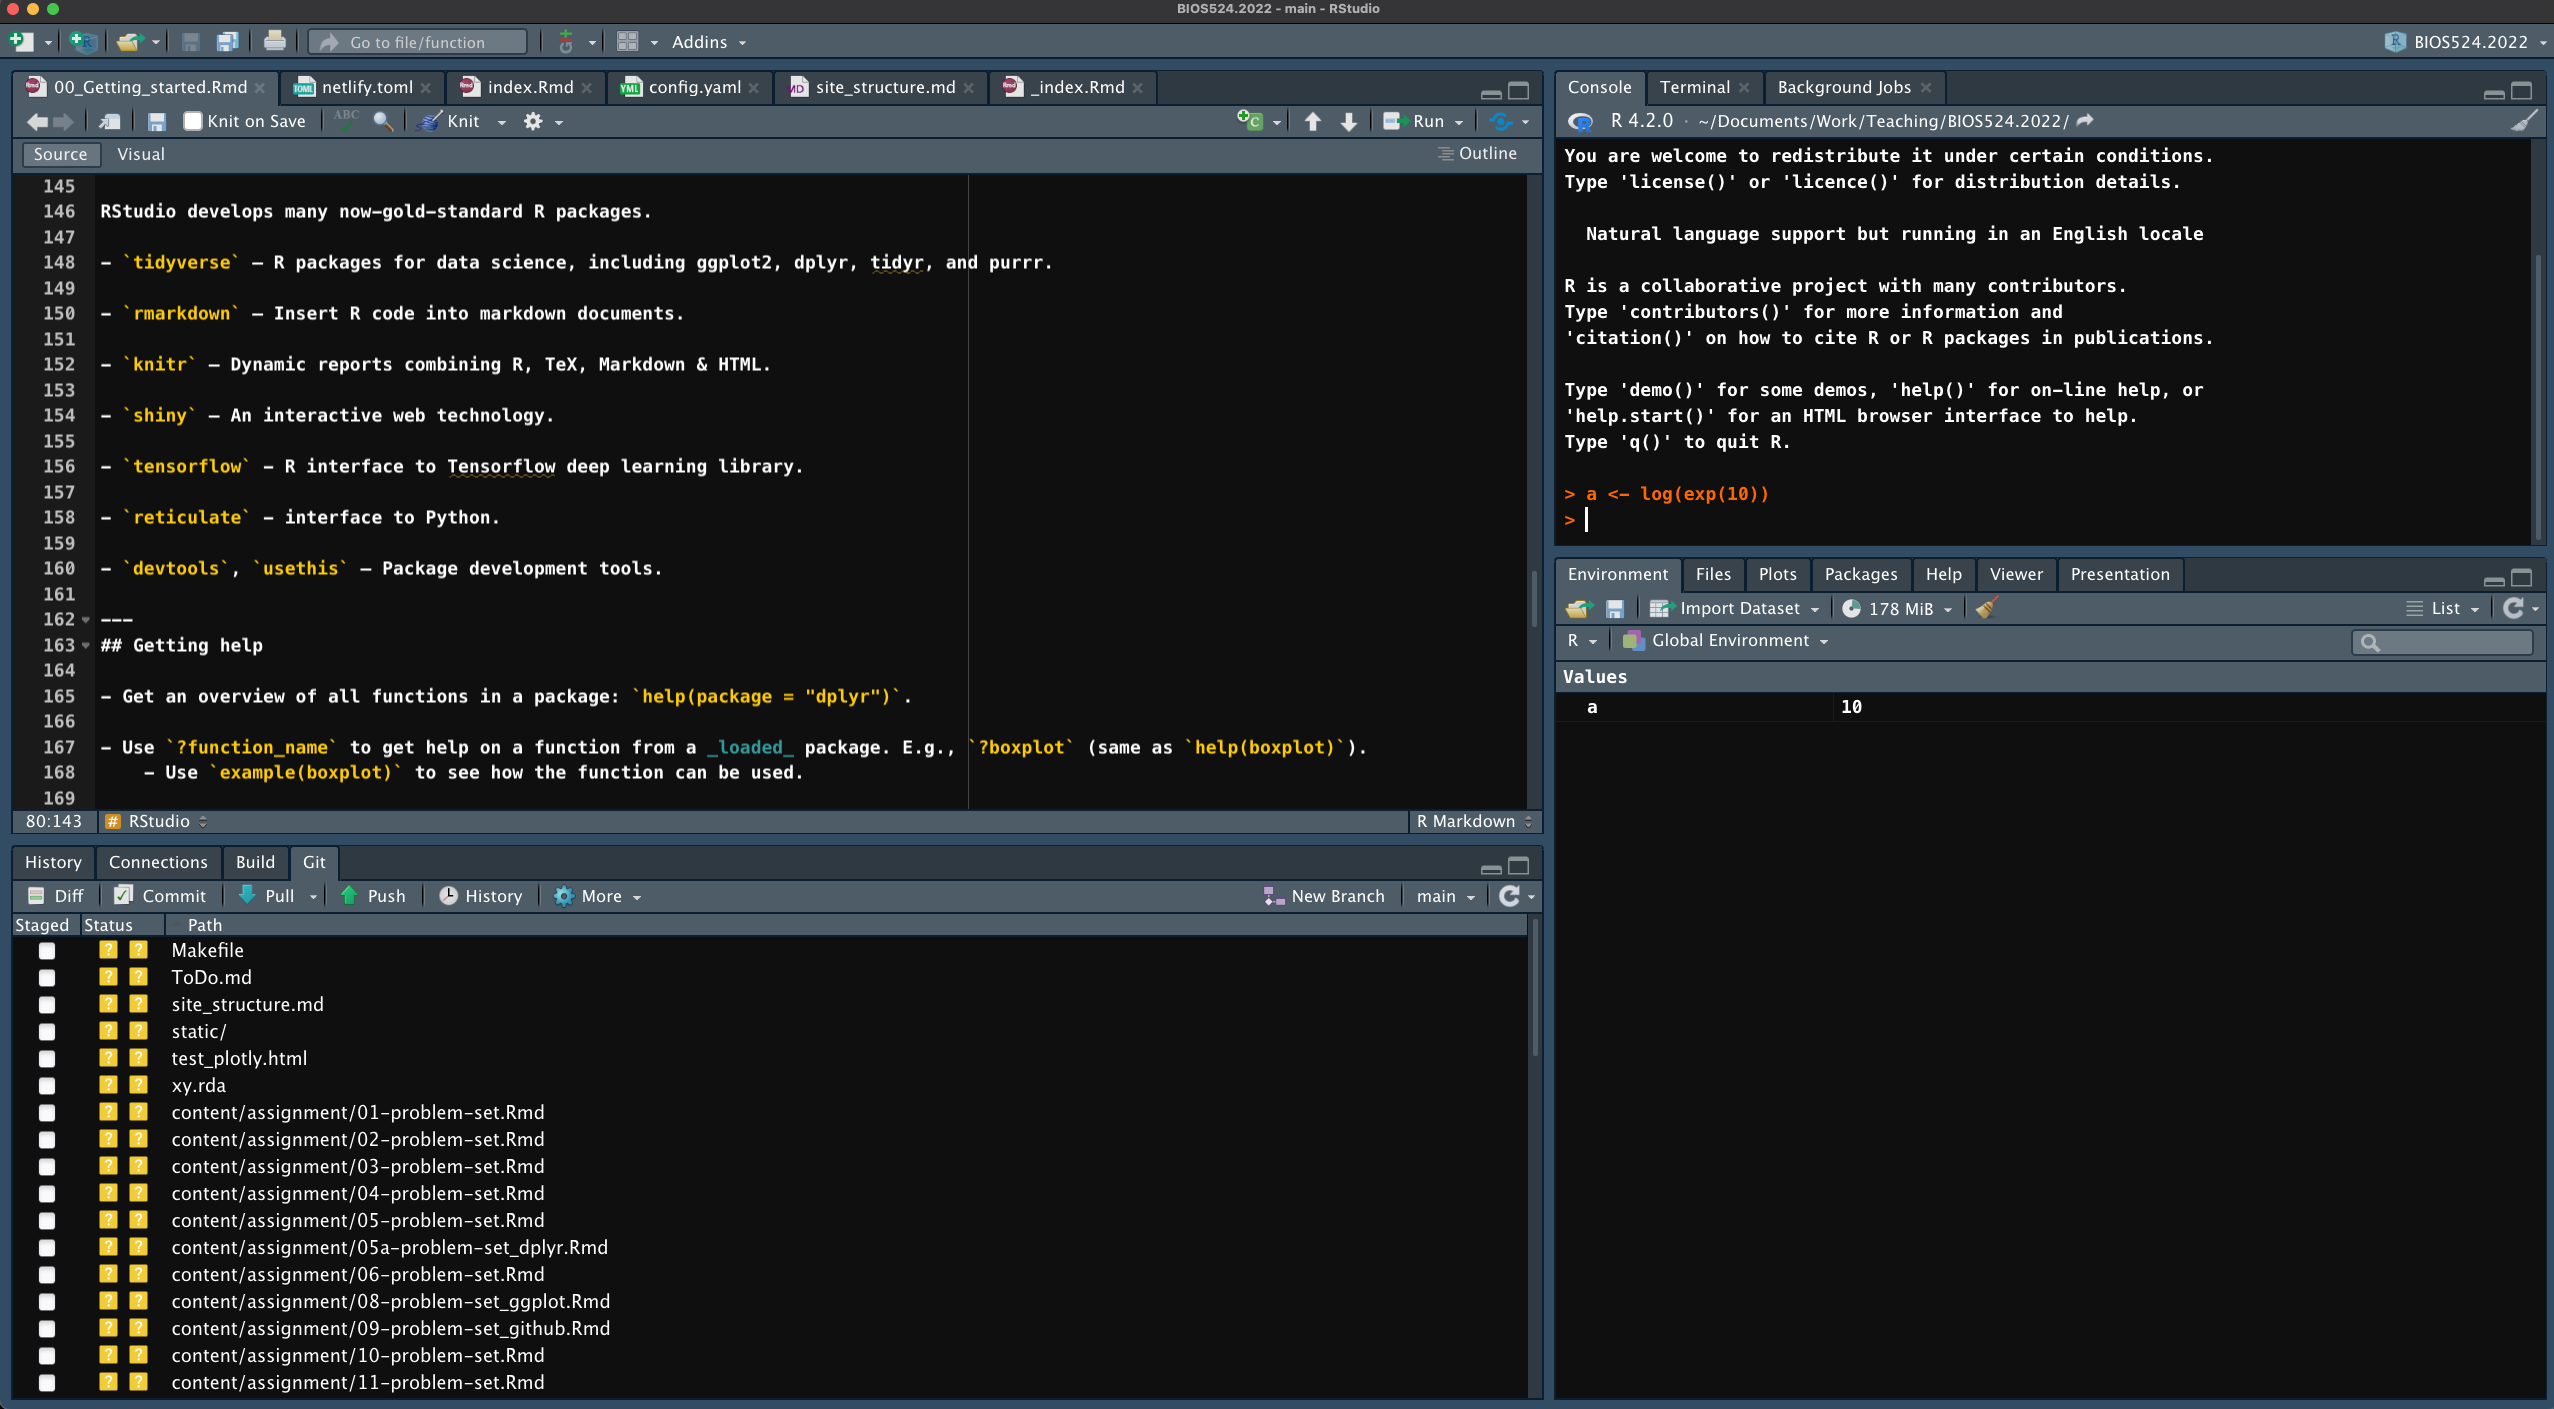
Single workspace with four (rearrangeable, zoomable) panels.
See all variables in R environment, easily visualize them.
Easy access to help, plots, packages.
Simple integration with Git version control system.
RStudio interface

RStudio interface
RStudio is divided into 4 panes, by default:
- Source for scripts and documents (top-left).
- Environment/History (top-right).
- Files/Plots/Packages/Help/Viewer (bottom-right).
- R Console (bottom-left).
Additional goodies:
- Autocompletion.
- Highlightning.
- Color themes.
- Keyboard shortcuts.
- Many more.
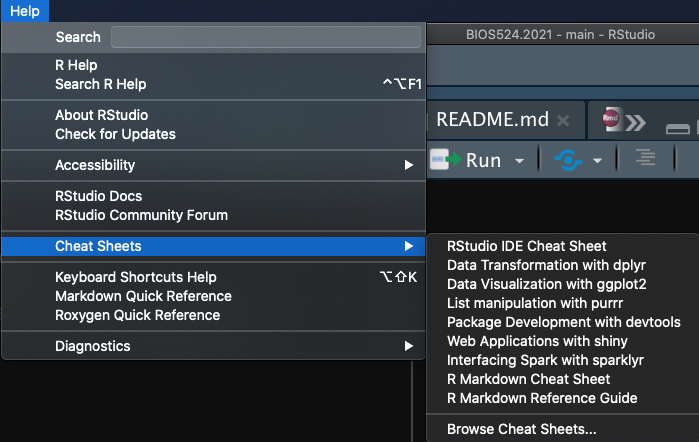
RStudio help

Installing and loading packages
# install.packages('cowsay')library(cowsay)say(what = "fortune", by = "rabbit")## ## ----- ## If you don't go with R now, you will someday.## David Kane## on whether to use R or S-PLUS## R-SIG-Finance## November 2004 ## ------ ## \ ## \## ( )_( )## (='.'=)## (^)_(^) [nosig]##RStudio is more than IDE
Posit develops many now-gold-standard R packages.
tidyverse- R packages for data science, including ggplot2, dplyr, tidyr, and purrr.rmarkdown- Insert R code into markdown documents.knitr- Dynamic reports combining R, TeX, Markdown & HTML.quarto- Publishing system for R, Python, Julia, Observable.shiny- An interactive web technology.tensorflow- R interface to Tensorflow deep learning library.reticulate- interface to Python.devtools,usethis- Package development tools.
Getting help
Get an overview of all functions in a package:
help(package = "dplyr").Use
?function_nameto get help on a function from a loaded package. E.g.,?boxplot(same ashelp(boxplot)).- Use
example(boxplot)to see how the function can be used.
- Use
Use
??function_nameto search for the function across all installed packages, even not loaded. E.g.,??ggplotly.Search engine is your best friend.
Getting data in and out of R

read.csv()write.csv()read.table()write.table()readr::read_csv()readr::write_csv()readr::read_tsv()readr::write_tsv()data.table::fread()data.table::fwrite()readxl::read_xlsx()writexl::write_xlsx()R datasets
R contains many datasets (stored as data frames) that are built-in to the software.
data() # All built-in datasets# ?treesdata(trees) # Load a particular onehead(trees)## Girth Height Volume## 1 8.3 70 10.3## 2 8.6 65 10.3## 3 8.8 63 10.2## 4 10.5 72 16.4## 5 10.7 81 18.8## 6 10.8 83 19.7Get started
https://posit.cloud/ - Posit Cloud free computing.
Introduction to bioinformatics, https://uclouvain-cbio.github.io/WSBIM1207/sec-rrstudio.html
Orientation to programming, R, and RStudio, https://gge-ucd.github.io/R-DAVIS/lesson_01_intro_r_rstudio.html
install.packages("swirl")library(swirl)## ## | Hi! I see that you have some variables saved in your workspace. To keep## | things running smoothly, I recommend you clean up before starting swirl.## ## | Type ls() to see a list of the variables in your workspace. Then, type## | rm(list=ls()) to clear your workspace.## ## | Type swirl() when you are ready to begin.