Reproducible reports with Markdown, knitr, BibTex, MathJax
Mikhail Dozmorov
Virginia Commonwealth University
09-06-2023
Literate programming
Let us change our traditional attitude to the construction of programs: Instead of imagining that our main task is to instruct a computer what to do, let us concentrate rather on explaining to humans what we want the computer to do.
- Donald E. Knuth, Literate Programming, 1984
Writing reports
HTML - HyperText Markup Language, used to create web pages. Developed in 1993
LaTeX - a typesetting system for production of technical/scientific documentation, PDF output. Developed in 1994
Sweave - a tool that allows embedding of the R code in LaTeX documents, PDF output. Developed in 2002
Markdown - a lightweight markup language for plain text formatting syntax. Easily converted to HTML, PDF, Word, and other formats
HTML example
- HTML files have
.htmor.htmlextensions - Pairs of tags define content/formatting
<h1> Header level 1 </h1><a href="http://www..."> Link </a><p> Paragraph </p>
<!DOCTYPE html><html><head><meta http-equiv="Content-Type" content="text/html; charset=utf-8"/></head><body><h1>Markdown example</h1><p>This is a simple example of a Markdown document.</p>You can emphasize code with <strong>bold</strong> or <em>italics</em>, or <code>monospace</code> font.</body></html>LaTeX example
- LaTeX files usually have a
.texextension - LaTeX commands define appearance of text, and other formatting structures
\documentclass{article}\usepackage{graphicx}\begin{document}
\title{Introduction to \LaTeX{}}
\author{Author's Name}\maketitle
\begin{abstract}
This is abstract text: This simple document shows very basic features of\LaTeX{}.\end{abstract}\section{Introduction}
Sweave example
- Sweave files typically have an
.Rnwextension - LaTeX for text,
<<chunk_name>>= <code> @syntax outlines code blocks
\documentclass{article}\usepackage{amsmath}\DeclareMathOperator{\logit}{logit}% \VignetteIndexEntry{Logit-Normal GLMM Examples}\begin{document}First we attach the data.<<gapminder>>=library(dslabs)data(gapminder)attach(gapminder)@Markdown
- Lightweight markup language.
- Uses plain text.
- Simple, human-readable syntax.
- Used for formatting documents, including slides.
- Popular among programmers and writers.
- Easily converted to presentation format.
- Simplifies content creation and editing.
R Markdown
- R Markdown is a Markdown markup language extended with the ability to add R code.
- The goal is still to separate form and content, but also to prioritize human-readability, even at the cost of fancy features
- You can learn Markdown in about 5 minutes. If you can write an email, you can write Markdown. See "Help -> Markdown Quick Reference" (also, "Cheatsheets")
- Can be converted in various document types, including HTML, PDF, MS Word, Beamer, HTML5 slides, Tufte-style handouts, books, dashboards, shiny applications, scientific articles, websites, and more.
- Fully supported in RStudio. Or, use a desktop Markdown editor like
MarkdownPad(Windows) orMacDown(Mac).
http://bioconnector.github.io/markdown - Markdown Reference
http://markdownpad.com/ - a full-featured Markdown editor for Windows
http://macdown.uranusjr.com/ - the open source Markdown editor for macOS
Basic Markdown Syntax
Regardless of your chosen output format, some basic syntax will be useful:
Section headers
Text emphasis
Lists
Rcode
Section Headers
To set up different sized header text in your document, use # for Header 1, ## for Header 2, and ### for Header 3.
# Table of content## Chapter 1### IntroductionRenders as
Table of content
Chapter 1
Introduction
Text emphasis
Italicize text via
*Italicize*or_Italicize_Bold text via
**Bold**or__Bold__
Unordered Lists
This code
- Item 1- Item 2 + Item 2a + Item 2bRenders these bullets (sub-lists need 1 tab or 4 spaces!)
- Item 1
- Item 2
- Item 2a
- Item 2b
Ordered Lists
This code
1. Item 12. Item 2 + Item 2a + Item 2bRenders this list (be advised - the bullets may not look great in all templates)
- Item 1
- Item 2
- Item 2a
- Item 2b
Inline R Code
- To use
Rwithin a line, use the syntax, wrapped in single forward ticks (can't be displayed)
## `r dim(mtx)`- This can be useful to refer to estimates, confidence intervals, p-values, etc. in the body of an article/homework without worrying about copy errors.
Markdown syntax
superscript^2^~~strikethrough~~Linkshttp://example.com[linked phrase](http://example.com)ImagesMarkdown syntax
BlockquotesA friend once said:> It's always better to give> than to receive.Horizontal Rule / Page Break*****------TablesFirst Header | Second Header------------- | -------------Content Cell | Content CellContent Cell | Content Cellhttps://www.tablesgenerator.com/markdown_tables
Large code chunks
Marked with triple backticks
```{r optionalChunkName, echo=TRUE, results='hide'} # R code here ``` Command+Option+I(Ctrl+Alt+Ion Windows) inserts R code chunkInsertbutton
Creating R markdown document
Regular text file with
.RmdextensionCreate manually, or use RStudio
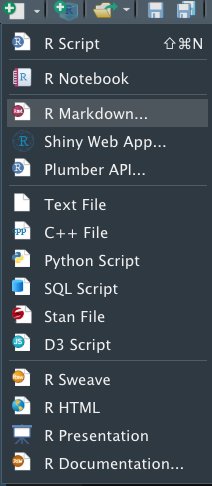
"File -> New File" menu provides options for creating various R documents

R Markdown formats from RStudio
Documents: HTML, PDF, Word, ODT, RTF
Presentations: ioslides, beamer, reveal.js, Slidy, Xaringan, PowerPoint
Journals: template packages for major journals/publishers
Web sites: bookdown, blogdown, pkgdown, flexdashboard, Shiny, GitHub document
More
https://rmarkdown.rstudio.com/formats.html
YAML header (think settings)
YAML - YAML Ain't Markup Language
YAML is a simple text-based format for specifying data, like JSON
---title: "Untitled"author: ”Your Name"date: ”Current date"output: html_document---output is the critical part - it defines the output format. Can be pdf_document or word_document, other formats available
YAML header for a PDF presentation
---title: "Reproducible reports with Markdown, knitr"author: "Mikhail Dozmorov"date: "2023-09-06"output: beamer_presentation: # colortheme: seahorse colortheme: dolphin fig_caption: no fig_height: 6 fig_width: 7 fonttheme: structurebold # theme: boxes theme: AnnArbor---YAML header for a Word document
---bibliography: [3D_refs.bib,brain.bib]csl: styles.ref/genomebiology.csloutput: word_document: reference_docx: styles.doc/NIH_grant_style.docx pdf_document: default html_document: default---Modifying the behavior of R code chunks
Chunk options, comma-separated
echo=FALSE- hides the code, but not the results/output. Default: TRUEeval=FALSE- disables code execution. Default: TRUEcache=TRUE- turn on caching of calculation-intensive chunk. Default: FALSEfig.width=##,fig.height=##- customize the size of a figure generated by the code chunkinclude: (TRUEby default) if this is set toFALSEthe R code is still evaluated, but neither the code nor the results are returned in the output document
Modifying the behavior of R code chunks
results="hide"- hides the results/output.markup(the default) takes the result of the R evaluation and turns it into markdown that is rendered as usual,hold- will hold all the output pieces and push them to the end of a chunk. Useful if you're running commands that result in lots of little pieces of output in the same chunkhidewill hide resultsasiswrites the raw results from R directly into the document. Only really useful for tables
The full list of options: http://yihui.name/knitr/options/
Global chunk options
- Some options you would like to set globally, instead of typing them for each chunk
knitr::opts_chunk$set(fig.width=12, fig.height=8, fig.path='img/’, cache.path='cache/', cache=FALSE, echo=FALSE, warning=FALSE, message=FALSE)warning=FALSEandmessage=FALSEsuppress any R warnings or messages from being included in the final documentfig.path='img/'- the figure files get placed in theimgsubdirectory. (Default: not saved at all)
Caching
The
cache=option is automatically set toFALSE. That is, every time you render the Rmd, all the R code is run again from scratchIf you use
cache=TRUE, for this chunk, knitr will save the results of the evaluation into a directory that you specify, e.g.,cache.path='cache/'. When you re-render the document,knitrwill first check if there are previously cached results under the cache directory before really evaluating the chunk- if cached results exist and this code chunk has not been changed since last run (use MD5 sum to verify), the cached results will be (lazy-) loaded, otherwise new cache will be built
- if a cached chunk depends on other chunks (see the
dependsonoption) and any one of these chunks has changed, this chunk must be forcibly updated (old cache will be purged)
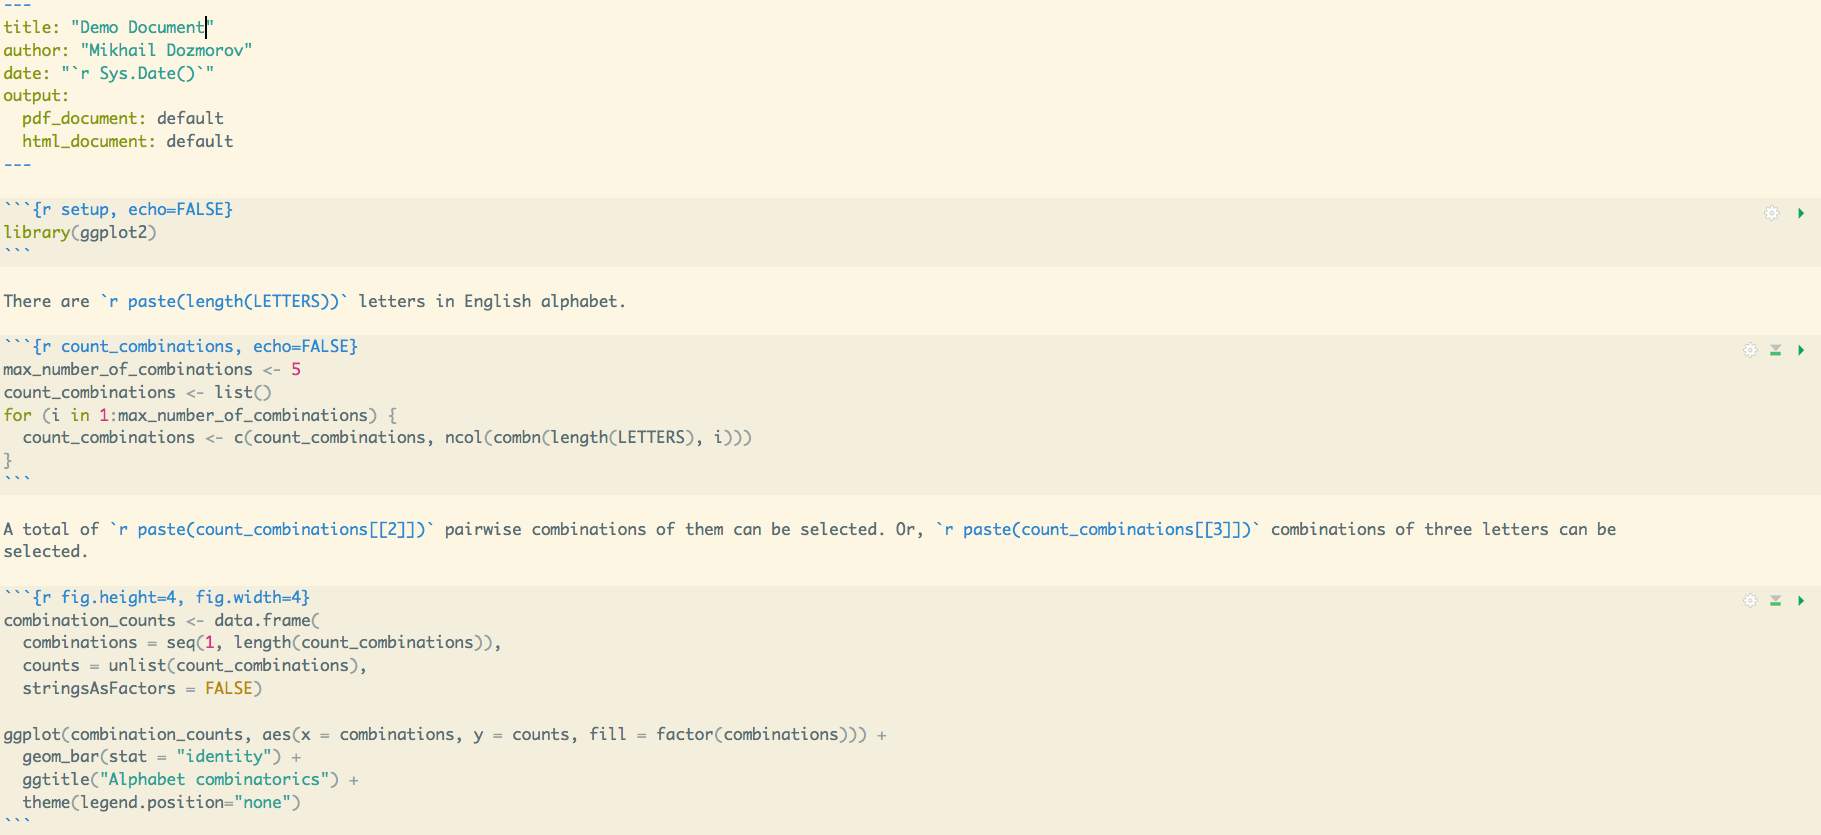
An example of R Markdown document

KnitR
KnitR- Elegant, flexible, and fast dynamic report generation written in R Markdown. PDF, HTML, DOCX output. Developed in 2012 by Yihui Xie
install.packages('knitr', dependencies = TRUE)To render a pdf from R Markdown, you need to have a version of TeX installed on your computer. Like R, TeX is open source software. RStudio recommends the following installations by system:
For Macs: MacTeX For PCs: MiKTeX Links for installing both can be found at http://www.latex-project.org/ftp.html
https://github.com/yihui/knitr, http://yihui.name/knitr/
Displaying data as tables
- KnitR has built-in function to display a table
data(mtcars)knitr::kable(head(mtcars))panderpackage allows more customization
pander::pander(head(mtcars))Displaying data as tables
xtablepackage has even more options
xtable::xtable(head(mtcars))- DT package, an R interface to the DataTables library
DT::datatable(mtcars)http://bioconnector.github.io/markdown/#!rmarkdown.md#Printing_tables_nicely
https://cran.r-project.org/web/packages/xtable/vignettes/xtableGallery.pdf
https://cran.r-project.org/web/packages/kableExtra/vignettes/awesome_table_in_html.html
Including figures
- Plots may be generated by R code and displayed in the output document
- Existing image files like
*.jpg,*.png, may be inserted like:
- Alternatively, use
knitrcapabilities:
{r, out.width = '300px', echo=FALSE}knitr::include_graphics('img/bandThree2.png')- For PDF output, use LaTeX syntax:
\begin{center}\includegraphics[height=170px]{img/bioinfo3.png}\end{center}Customizing Figures
The fig.cap option allows you to specify the caption for the figure generated by a given chunk:
```{r caption, fig.cap="I am the caption"}plot(pressure)```The fig.height and fig.width options let you specify the dimensions of your plots:
```{r caption, fig.height = 4, fig.width = 8}plot(pressure)```Creating the final report
Markdown documents (
*.mdor*.Rmd) can be converted to HTML usingmarkdown::markdownToHTML('markdown_example.md', 'markdown_example.html')Another option is to use
rmarkdown::render('markdown_example.md’). At the backend it usespandoccommand line tool, installed with RstudioRstudio - one button.
knit2html(),knit2pdf()functions
Note: KnitR compiles the document in an R environment separate from yours (think Makefile). Do not use ./Rprofile file - it loads into your environment only.
Things to include in your final report
set.seed(12345) - initialize random number generator
Include session_info() at the end - outputs all packages/versions used
```{r sessionInfo} diagnostics <- devtools::session_info() platform <- data.frame(diagnostics$platform %>% unlist, stringsAsFactors = FALSE) colnames(platform) <- c('description') pander(platform) packages <- as.data.frame(diagnostics$packages) pander(packages[ packages$`*` == '*', ]) ``` Alternatively
{r sessionInfo}
     xfun::session_info()
Making default RMarkdown document on your own
Altering the default Rmarkdown file each time you write a homework, report, or article would be a pain.
- Fortunately, you don't have to!
Templates
You can create your own templates which set-up packages, fonts, default chunk options, etc.
https://bookdown.org/yihui/rmarkdown/document-templates.html
Some packages (e.g
rticles) provide templates that meet journal requirements or provide other.- Journal of Statistical Software
- The R Journal
- Association for Computing Machinery
- ACS publications (Journal of the American Chemical Society, Environmental Science & Technology)
- Elsevier publications
https://github.com/mdozmorov/MDtemplate
Parameters
You may also set parameters in your document's YAML header
---output: html_documentparams: date: "2017-11-02"---or pass new values with the render function.
This creates a read-only list
paramscontaining the values declarede.g.
params$datereturns2017-11-02
Bibliography
BibTex
@article{Berkum:2010aa, Abstract = {The three-dimensional folding of chromosomes ...}, Author = {van Berkum, Nynke L and Lieberman-Aiden, Erez and Williams, Louise and Imakaev, Maxim and Gnirke, Andreas and Mirny, Leonid A and Dekker, Job and Lander, Eric S}, Date-Added = {2016-10-08 14:26:23 +0000}, Date-Modified = {2016-10-08 14:26:23 +0000}, Doi = {10.3791/1869}, Journal = {J Vis Exp}, Journal-Full = {Journal of visualized experiments : JoVE}, Mesh = {Chromosome Positioning; Chromosomes; DNA; Genomics; Nucleic Acid Conformation}, Number = {39}, Pmc = {PMC3149993}, Pmid = {20461051}, Pst = {epublish}, Title = {Hi-C: a method to study the three-dimensional architecture of genomes}, Year = {2010}, Bdsk-Url-1 = {http://dx.doi.org/10.3791/1869}}BibTex managers
JabReffor Windows, http://www.jabref.org/BibDeskfor Mac, http://bibdesk.sourceforge.net/- https://github.com/dsanson/bibdesk-pandoc-export-templates - for Dragging and Dropping Pandoc-Style Citations from BibDesk
Save references in .bib text file
Convert anything to BibTex
doi2bib - BibTex from DOI, arXiv, biorXiv. https://www.doi2bib.org/
Google Scholar - "Cite" as BibTeX functionality, https://scholar.google.com/
ZoteroBib - create a bibliography from a URL, ISBN, DOI, PMID, arXiv ID, or title. Download as BibTex and more. https://zbib.org/
BibTex and RMarkdown
Add to YAML header
bibliography: 3D_refs.bibInsert into RMarkdown as
The 3D structure of the human genome has proven to be highly organized [@Dixon:2012aa; @Rao:2014aa]. This organization starts from distinct chromosome territories [@Cremer:2010aa], following by topologically associated domains (TADs) [@Dixon:2012aa; @Jackson:1998aa; @Ma:1998aa; @Nora:2012aa; @Sexton:2012aa], smaller "sub-TADs" [@Phillips-Cremins:2013aa; @Rao:2014aa] and, on the most local level, individual regions of interacting chromatin [@Rao:2014aa; @Dowen:2014aa; @Ji:2016aa].Format your BibTex references
Add to YAML header
csl: genomebiology.cslGet more styles at https://www.zotero.org/styles
Format your Word output
If knitting into Word output, you may want to have fonts, headers, margins other than default.
Create a Word document with the desired formatting. Change font styles by right-clicking on the font (e.g., "Normal") and select "Modify"
Include it into YAML header
output: word_document: reference_docx: styles.doc/NIH_grant_style.docxMath formulas
Markdown Code: MathJax
- Markdown supports MathJax JavaScript engine to render mathematical equations and formulas
- Inline equations - use single "dollar sign"
$to specify MathJax coding
$s^{2} = \frac{\sum(x-\bar{x})^2}{n-1}$s2=∑(x−¯x)2n−1
Check out this online tutorial http://meta.math.stackexchange.com/questions/5020/mathjax-basic-tutorial-and-quick-reference
MathJax_2.Rmd - Mathjax example
Centering you equations
Insertion of two dollar signs $$ centers your equations. Other examples, off set and centered - notice double dollar signs:
$ \sum_{i=0}^n i^2 = \frac{(n^2+n)(2n+1)}{6} $ $$ \sum_{i=0}^n i^2 = \frac{(n^2+n)(2n+1)}{6} $$Inline equation ∑ni=0i2=(n2+n)(2n+1)6 on the same line. Or, self-standing equation on a separate line n∑i=0i2=(n2+n)(2n+1)6
More Interesting Codes:
Greek Letters
$\alpha$ $\beta$ $\gamma$ $\chi$ $\Delta$ $\Sigma$ $\Omega$Greek Letters: (not all capitalized Greek letters available)
α β γ χ
Δ Σ Ω
superscripts (^) and subscripts (_)
x2i log2x
Grouping with Brackets
Use brackets {...} to delimit a formula containing a superscript or subscript. Notice the difference the grouping makes:
${x^y}^z$$x^{y^z}$ $x_i^2$$x_{i^2}$xyz xyz x2i xi2
Scaling:
Add the scaling code \left(...\right) to make automatic size adjustments
$(\frac{\sqrt x}{y^3})$$\left(\frac{\sqrt x}{y^3}\right)$(√xy3) (√xy3)
Sums and Integrals
Subscript (_) designates the lower limit; superscript (^) designates upper limit:
$\sum_1^n$ $\sum_{i=0}^\infty i^2$∑n1 ∑∞i=0i2
Other notable symbols:
- $\prod$ $\infty$ - $\bigcup$ $\bigcap$- $\int$ $\iint$∏ ∞ ⋃ ⋂ ∫ ∬
Radical Signs
Use 'sqrt' code to adjust the size of its argument. Note the change in size of the square root function based on the code
1. $sqrt{x^3}$2. $sqrt[3]{\frac xy}$ and for complicated expressions use brackets3. ${...}^{1/2}$- √x3
- 3√xy
- ...1/2
You can also change fonts!
$\mathbb or $Bbb for 'Blackboard bold"$\mathbf for boldface $\mathtt for 'typewritter' font$\mathrm for roman font$\mathsf for sans-serif$\mathcal for 'caligraphy' $\mathscr for script letter: $\mathfrak for "Fraktur" (old German style)ABCDEFG ABCDEFG ABCDEFG ABCDEFG ABCDEFG ABCDEFG
You can also change fonts!
Some special functions such as "lim" "sin" "max" and "ln" are normally set in roman font instead of italic. Use \lim, \sin to make these (roman):
$\sin x$ (roman) vs $sin x$ (italics)sinx (roman) vs sinx (italics)
And, add curly brackets
$$\begin{cases}\widehat{IF_{1D}} = IF_{1D} - f(D)/2 \\\widehat{IF_{2D}} = IF_{2D} + f(D)/2\end{cases} \ (1)$${ˆIF1D=IF1D−f(D)/2ˆIF2D=IF2D+f(D)/2 (1)
RStudio bonus
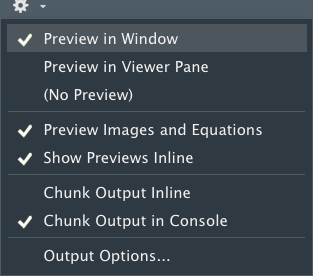
Inline preview of forumlas and images in an RMarkdown document

Preview online https://www.codecogs.com/latex/eqneditor.php
LaTeX and Markdown
Rendering Markdown as a pdf requires a LaTeX installation
You will additionally need to install Pandoc from http://pandoc.org/
With LaTeX, many customizations are possible
LaTeX Customization, 1
You can include additional LaTeX commands and content
Use the
includesoption as follows to add your favorite style files for the preamble, title/abstract, bibliography, etc...
---title: 'A More Organized Person's Document'output: beamer_presentation: includes: in_header: header.tex before_body: doc_prefix.tex after_body: doc_suffix.tex---LaTeX Customization, 2
- If you prefer a self-contained document, you may opt for the
header-includesoption over the modular approach:
---title: 'BIOS 691: Reproducible Research Tools'author: "Author Name"date: "November 2, 2017"header-includes: - \usepackage{graphicx}output: beamer_presentation: theme: "Frankfurt"---Quarto
Quarto is an open-source scientific and technical publishing system built on Pandoc.
- Python, R, Julia, and Observable support.
- Author documents as Markdown or Jupyter notebooks.
- Articles, reports, presentations, websites, blogs, and books in HTML, PDF, MS Word, ePub, and more.
- Supports scientific markdown, including equations, citations, crossrefs, figure panels, callouts, advanced layout, and more.
- Improved figure/table cross-referencing, labeling.
https://quarto.org/docs/get-started/
Quarto - J.J. Allaire 1h video